Data clarity.
Executive decisions.
Power BI architecture that speaks your language.
We build the reporting infrastructure that leadership teams trust. Power BI engineering for organizations that need their data to work.
Track Record
Dashboards Delivered
Active in production today
Identified Savings
Found in client data
Return Engagements
Clients who come back
Average ROI
First-year returns
Case Studies
Before and after: what data clarity looks like in practice.
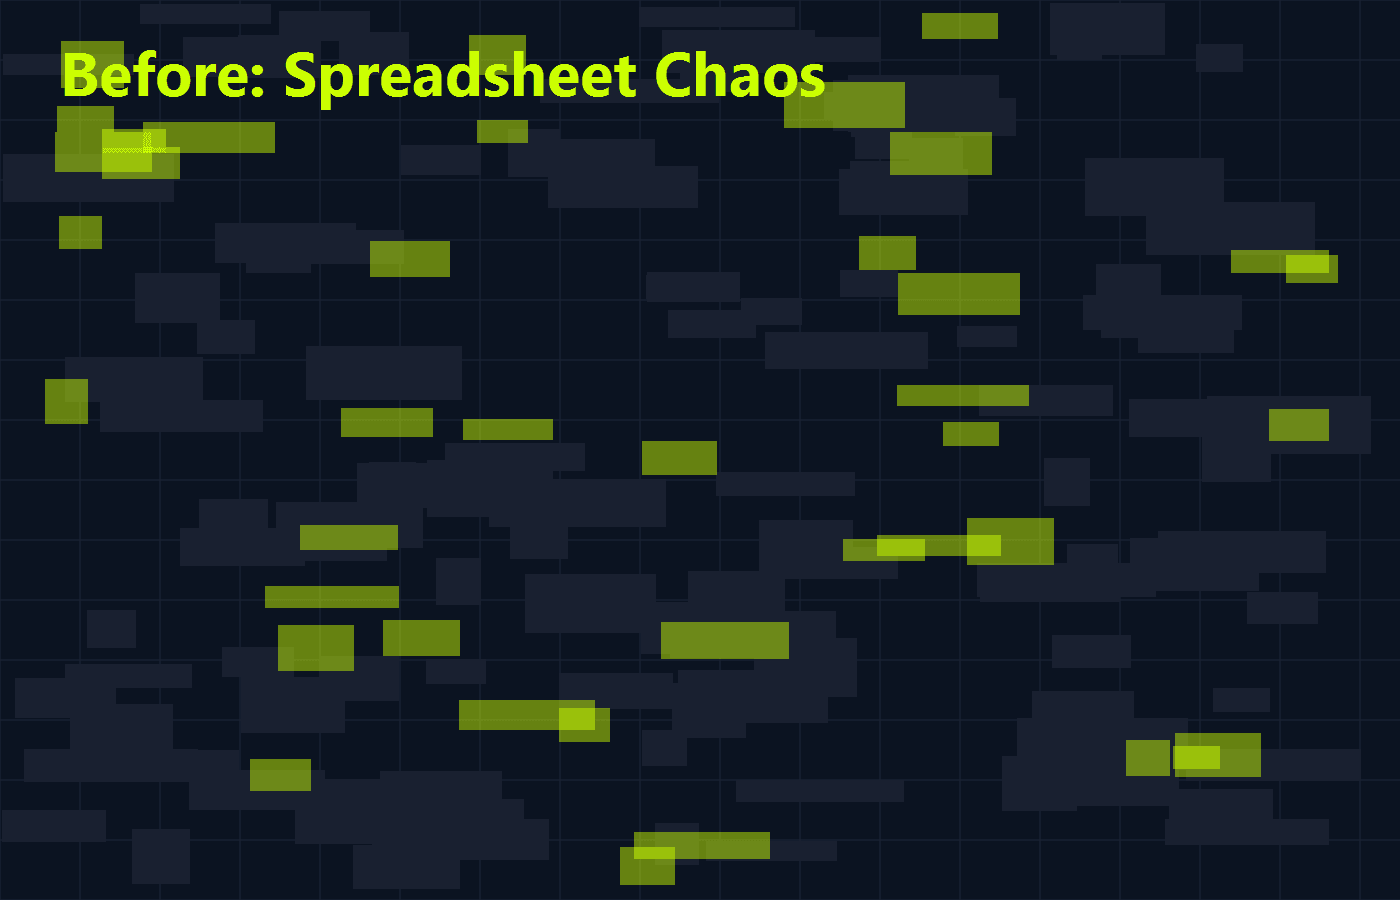
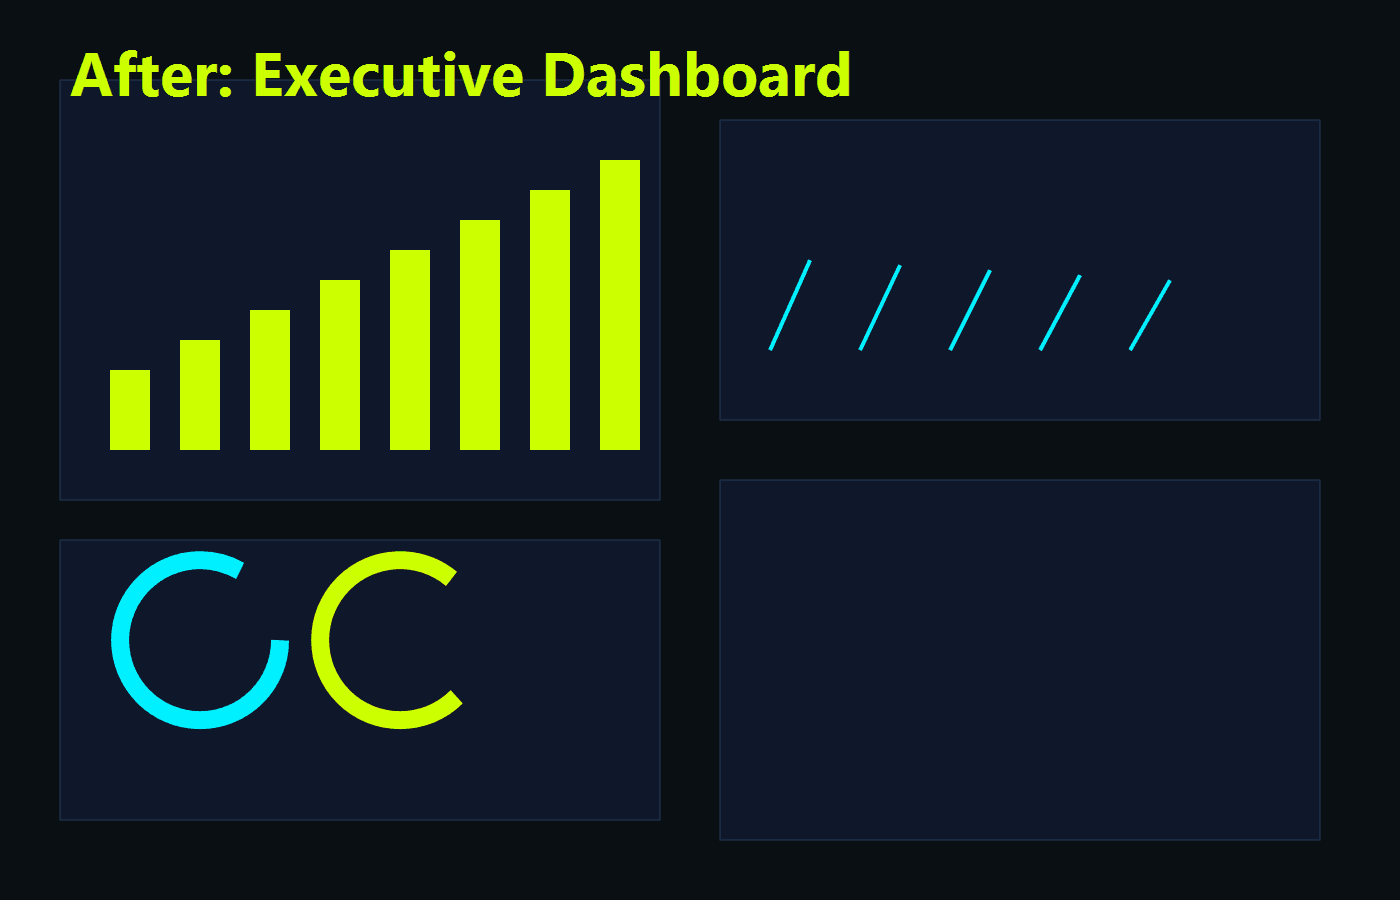
Fortune 500 Supply Chain Overhaul
From spreadsheet hell to real-time clarity
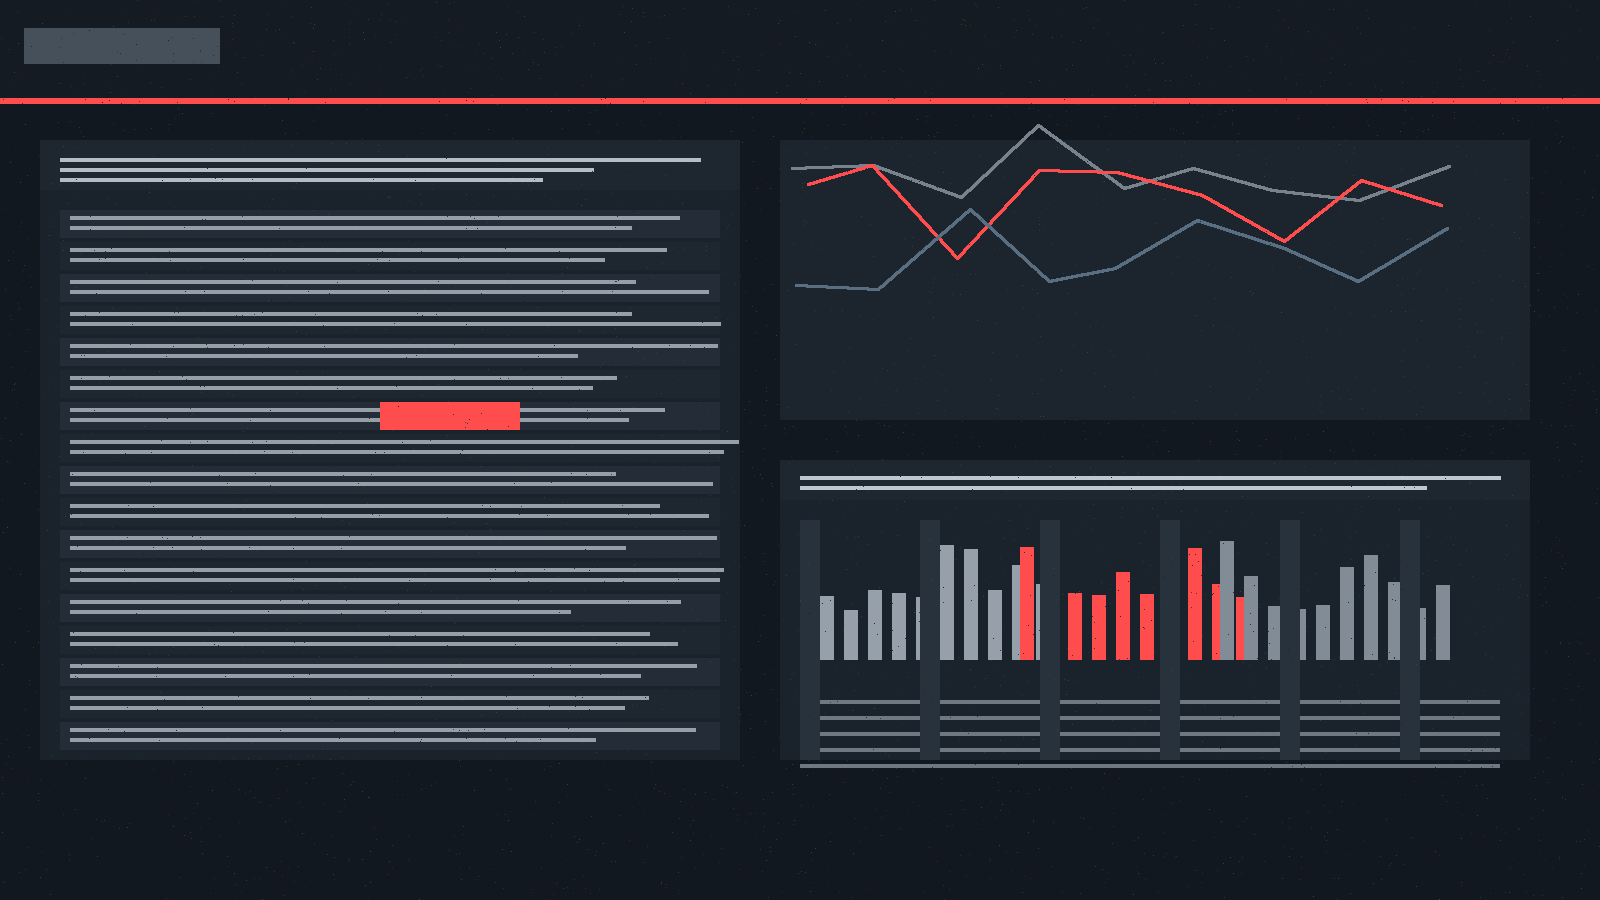
Healthcare Analytics Platform
Patient outcomes visualized for C-suite decisions
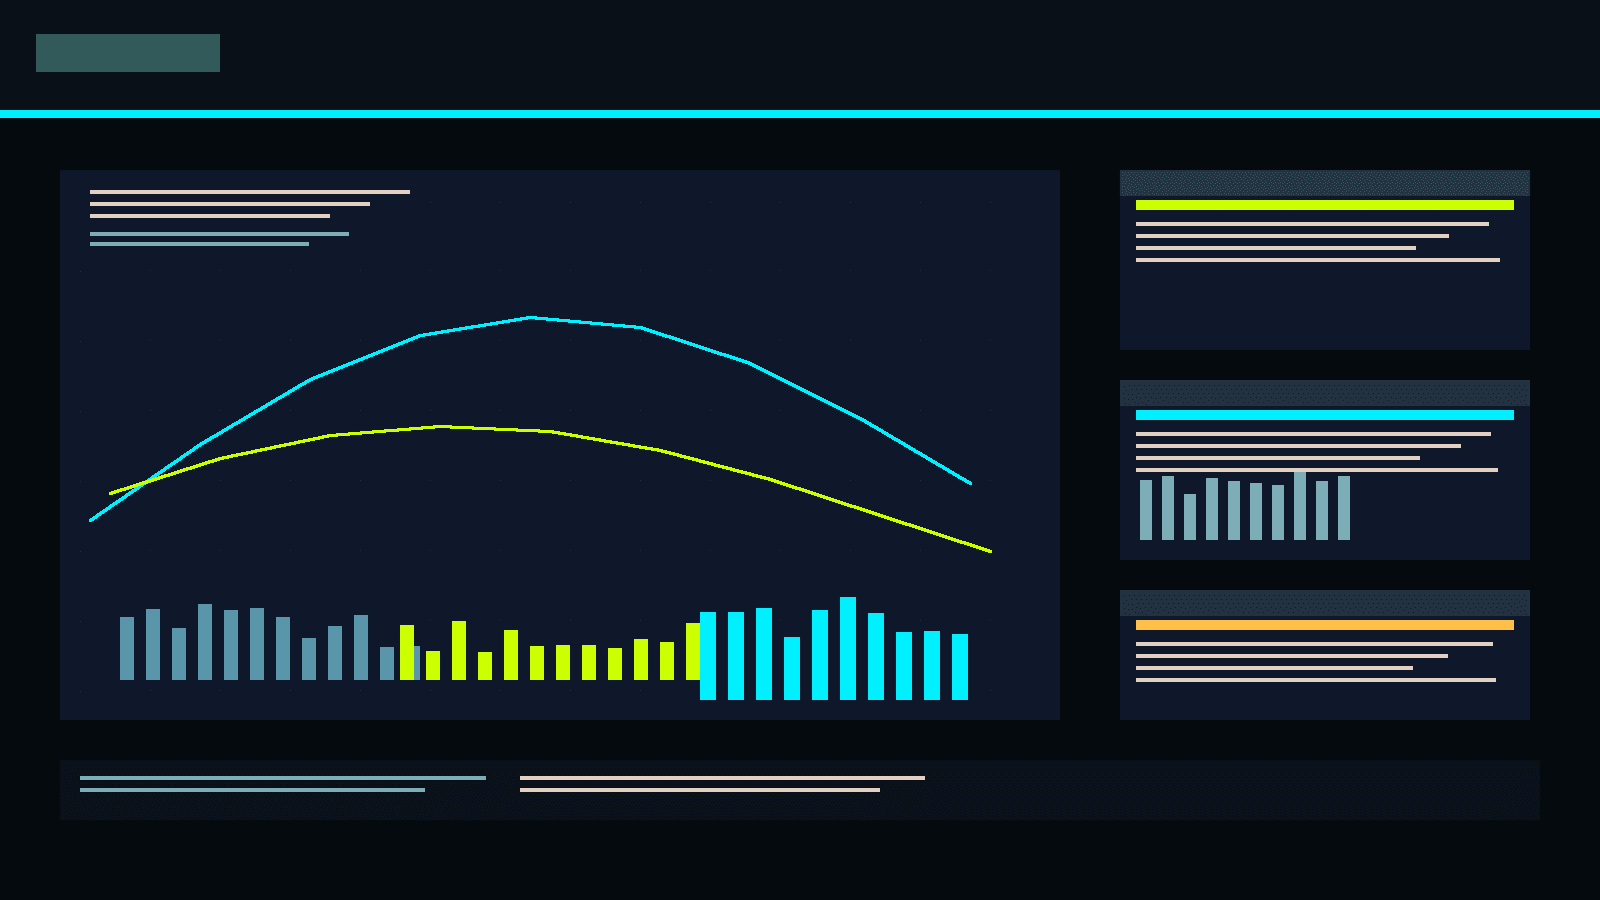
Cross-Department Reporting Consolidation
A federal agency with 12 departments, each using different reporting tools and definitions. Leadership couldn't get a unified view of operations—reports contradicted each other, and decisions were made on incomplete data.
We built a semantic layer that standardized definitions across departments, created automated data quality checks, and deployed a single dashboard that the entire executive team now references in weekly meetings.
Ready to see what clarity looks like for your organization?
Start a conversation→The Digital Dojo
The principles that shaped empires apply to boardrooms. Explore decision frameworks drawn from Stoic philosophy, systems theory, and behavioral economics.
Click nodes to explore. Drag to navigate.
Foundational Disciplines
Via Negativa
Addition by subtraction. Wisdom lies not in what you add, but what you refuse. The discipline that built Berkshire and shaped Stoic philosophy.
Available Soon →Second-Order Effects
Every action creates ripples. Train yourself to see the consequences of consequences—the skill that separates strategists from tacticians.
Available Soon →Asymmetric Positioning
Structure decisions where upside dwarfs downside. The operating principle behind venture capital, options trading, and antifragile organizations.
Available Soon →Get notified when frameworks launch
Join the list. No spam—just frameworks when they're ready.
Client Outcomes
From the executives we've partnered with.
"We had seven different reporting systems before Alston. Now we have one dashboard that the entire C-suite trusts. The difference in our quarterly planning alone was worth it."
Sarah Chen
VP of Operations
Regional Health Network
"Within the first review, we found $2.4M in supply chain inefficiencies that had been invisible for years. The data was there—we just couldn't see it until now."
Marcus Thompson
Director of Analytics
Fortune 500 Manufacturing
"Most consultants hand you a deck and disappear. Will stayed until our team could run the system independently. That handoff made the entire engagement worthwhile."
Jennifer Walsh
Chief Data Officer
Federal Agency
The Command Line
Let's discuss what you're building.
Prefer the old ways?